The economic theory of PPP is commonly used to compare the economic health of countries across the world. We take a look at the different types of purchasing power parity and how the theory applies to financial markets.
Purchasing power parity (PPP) is an economic theory of exchange rate determination. It states that the price levels between two countries should be equal.
This means that goods in each country will cost the same once the currencies have been exchanged. For example, if the price of a Coca Cola in the UK was 100p, and it was $1.50 in the US, then the GBP/USD exchange rate should be 1.50 (the US price divided by the UK’s) according to the PPP theory.
However, if you were then to look at the market exchange rate of the GBP/USD pair, it is actually closer to 1.25. The discrepancy occurs because the purchasing power of these currencies is different. As with any asset, there is the real value of a currency and the notional value, which financial markets trade at. The aim of the PPP measurement is to make comparisons between two currencies more valid, by adjusting for local purchasing power differences.
PPP measures are widely used by global institutions, such as the World Bank, United Nations, International Monetary Fund and European Union.
The economic theory is often broken down into two main concepts:
⦁ Absolute purchasing power parity
⦁ Relative purchasing power parity
1. Absolute parity
Absolute purchasing power parity (APPP) is the basic PPP theory, which states that once two currencies have been exchanged, a basket of goods should have the same value. Usually, the theory is based on converting other world currencies into the US dollar.
For example, if the price of a can of Coca Cola was $1.50, APPP would suggest that a can of Coca Cola in any other country should cost $1.50 after you’ve converted USD into the local currency.
If this does not hold true, then APPP suggests that the currency exchange rate will change over time until the goods are of equal value – as without any barriers to trade, there should be an equilibrium in the price of goods. This is a completely price-level theory, which only looks at the exact same basket of goods in each country, with no other factors included.
However, the theory ignores the existence of inflation and consumer spending, as well as transportation costs and tariffs, which can impact the short-term exchange rate. Without these inclusions, a currency’s power is poorly represented.
2. Relative parity
Relative purchasing power parity (RPPP) is an extension of APPP and can be used in tandem with the first concept. While it maintains that the value of the same good in different countries should equal out over time, RPPP suggests that there is a correlation between price inflation and currency exchange rates. It looks at the amount of a good or service that one unit of currency can buy, which can change over time as inflation rates alter. The theory suggests that inflation will reduce the real purchasing power of a currency, so in order to properly adjust the PPP, inflation must be taken into account.
For example, if the UK had an annual inflation rate of 2%, then one unit of pound sterling would be able to purchase 2% less per year.
One we add this concept onto APPP, we can see that inflation rates will account for part of the change in the power of currencies. So suppose that the UK has a 2% inflation rate, while Brazil has a 5% inflation rate. This means that after one year, the price of a basket of goods in Brazil has increased by 5%, while the same basket of goods in the UK has only increased by 2%.
How to calculate PPP: the PPP formula
The PPP formula calculation will vary depending on what you are trying to achieve and which PPP you want to use.
The absolute PPP calculation is calculated by dividing the cost of a good in one currency, by the cost of a good in another currency (usually the US dollar).
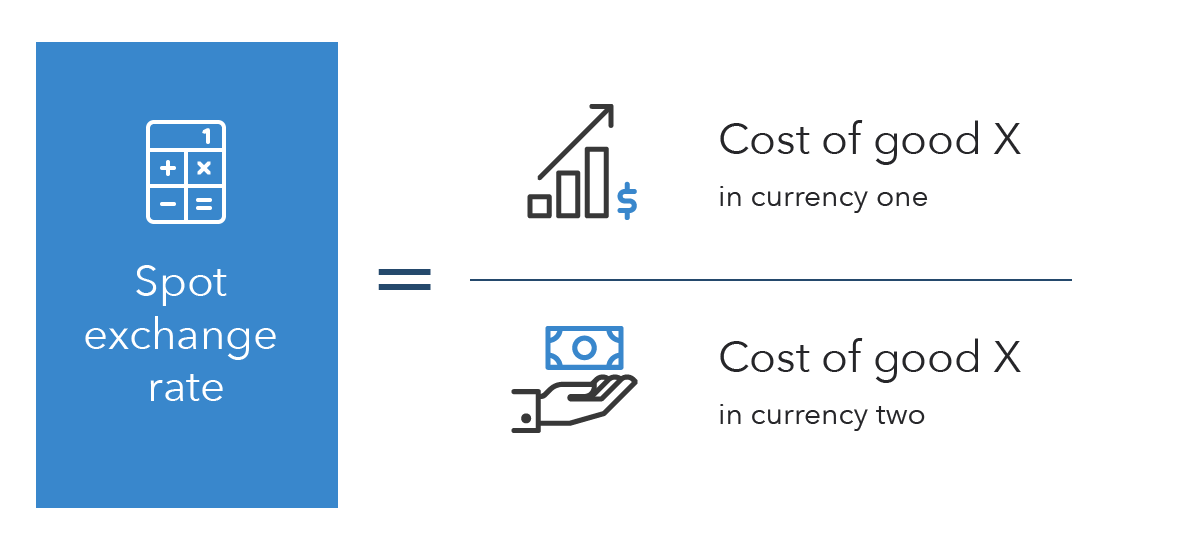
Then, to calculate the relative PPP rate, you’d simply assume that the ratio of price levels was equal to the exchange rate from one currency to another, adjusted for the inflation rate. This would give you the rate of depreciation for one currency compared to another, and an estimate of the future exchange rate.

What is the relationship between PPP and GDP?
Purchasing power parity is one of the most common metrics used to measure gross domestic product (GDP) – which is the total market value of goods and services produced in a country within a given period. Each country has to record and report its own data, which is then compared to other countries to assess economic performance.
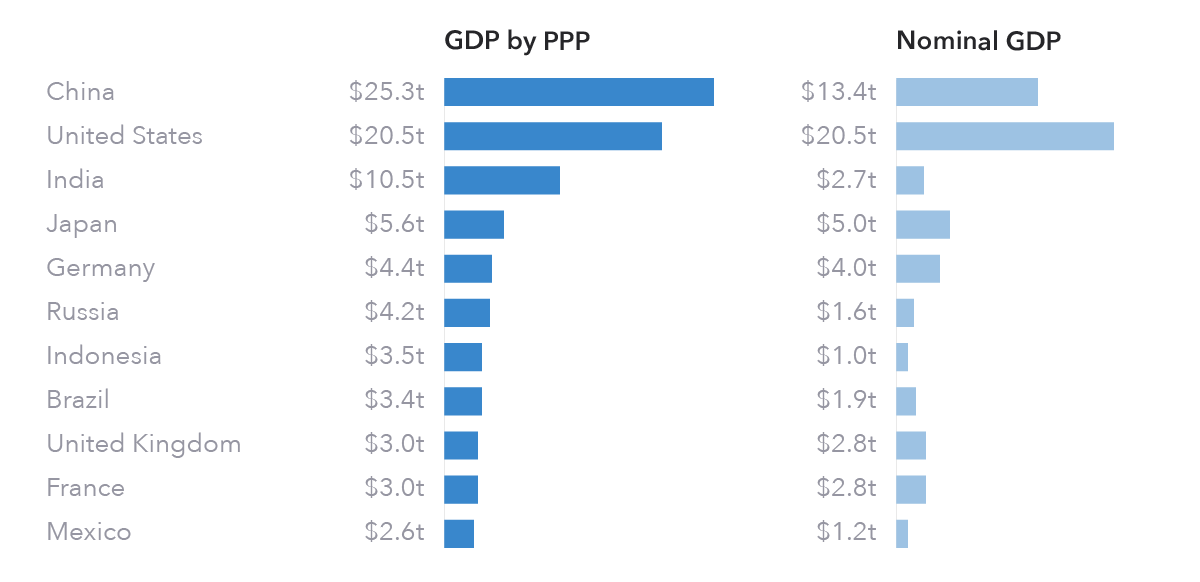
The alternative metric to ‘GDP by PPP’ is ‘nominal GDP’, which simply takes a country’s exchange rate and converts the GDP value. However, there are two issues with doing this: exchange rates are volatile, and exchange rates only measure traded goods. Using volatile forex rates alone doesn’t account for the fact that although each currency fluctuates in value – changing how a country’s GDP compares to others – the living standards in the country might not change. The exchange rate doesn’t look at living situations and non-traded goods, such as the price of getting the train, housing or getting a haircut. It only impacts goods that are exchanged across borders, rather than domestically.
Due to the large differences in price levels between developed and developing economies, it might not be enough to simply countries market rate converted GDP. This is why using GDP by PPP has become a popular metric.
Source: IMF
Let’s take a look at GDP in 2018. If we looked at nominal GDP alone as a measure of economic prosperity, then the US would come out on top – with a total of $20.5 trillion – compared to China in second place, with just $13.4 trillion.1 However, when we look at the same figures adjusted for purchasing power parity, China takes the lead – with $25.3 trillion compared to the US’s $20.5 trillion.2
The theory goes that this is because non-traded goods and services, and the cost of living, tend to be cheaper in low-income rather than high-income countries. So, in countries that are labour-intensive, the real incomes and power of a currency might be several times higher than is suggested by the nominal GDP.
The assumption here is that tradable goods are more closely aligned with nominal exchange rates, while non-tradeable goods and services are closer to the PPP rate.
How to use purchasing power parity
On a macroeconomic level, the PPP measurement is used to compare economic productivity and living standards between countries – as we have seen above, it is most commonly used to adjust GDP. However, there are so many other ways that individuals and institutions can use PPP to interpret socioeconomic data. These include assessing contributions to carbon emissions, measuring global poverty and even predicting financial markets.
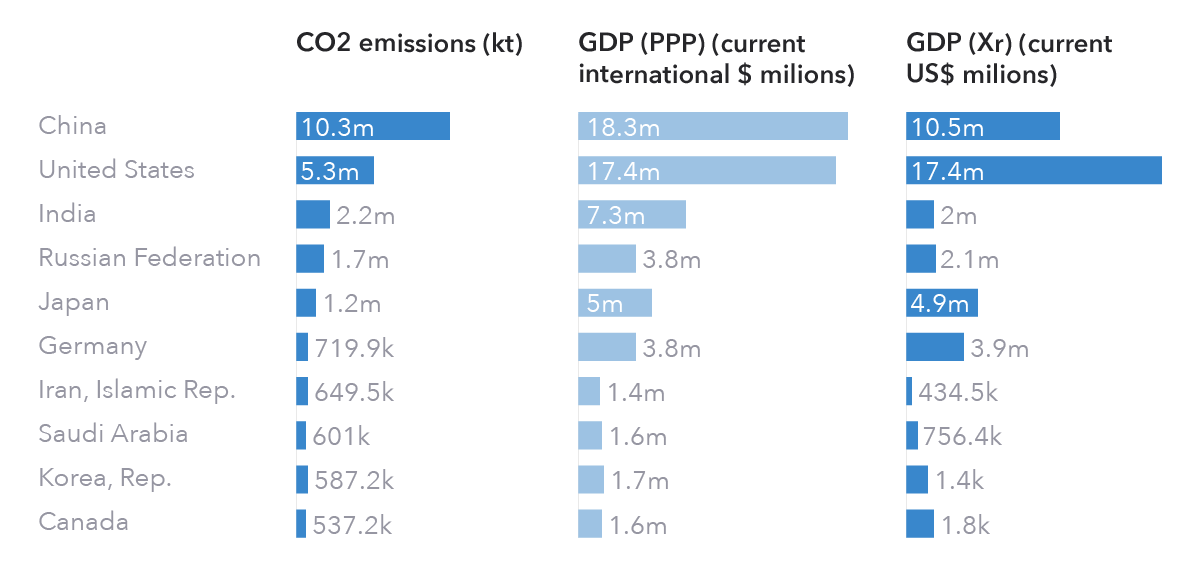
The World Bank states that ‘the GDP (PPP) measure more accurately compares the volume of activity and production of a country to another’,3 which is why it uses the metric to look at the relationship between economy and carbon emissions.
Source: World Bank
By looking at the above charts, we can see that in 2014, GDP in PPP more accurately represents the patterns of carbon emissions in each country than GDP at the exchange rate at the time. For example, the nominal GDP would imply that the US is the largest output of carbon, whereas PPP conforms to the carbon data, showing China as the largest source. This is because the PPP is believed to reflect the industrial production of countries better.
PPP data is also commonly used to measure global poverty. Analysts use global PPP data to assess how changing price levels impact the number of individuals below the poverty line, and readjust the global estimates of how long it will be until poverty ends. In 2011, the PPP adjusted poverty line was set at $1.90 per day – indicating that anyone who earns less than this globally is considered to be in extreme poverty.
Purchasing power parity is also widely used to identify market manipulation by governments. Although uncommon, there have been historic cases of government’s manipulating inflation data in order to present a healthier economy and boost the currency’s value. For example, in 2011, the Big Mac index proved that the Argentinian government had been reporting incorrect inflation data – the PPP index showed there was a 19% gap between the burger’s actual price and the PPP implied price.
Purchasing power parity and financial markets
Purchasing power parity is a common tool used by traders to assess when an asset is over or under-valued. It is mostly used to analyse forex pairs and stocks.
Purchasing power parity and forex
Traders can use any disparity between the PPP rate and exchange rate to assess a currency’s long-term forecast and valuation. It is possible to use the rates to predict the direction of a currency pair and use it to determine whether to buy or sell a currency pair.
However, it should not be the only measure used due to the limitations of PPP. Economic theories are merely an idea on where the markets could go, but it is vital to use technical and fundamental analysis to gain a more developed view of price movements.
The theory goes that currencies will converge to a point of equilibrium. So, if there is disparity between the exchange rate and PPP rates, then an individual can aim to trade the move toward this central point. If the PPP rate indicates a currency is over-valued compared to another, then a trader would consider going short on the currency in question. While, if the PPP rate shows the currency is under-valued against the USD, they could consider taking a long view of the market.
The PPP theory assumes that a decline in the purchasing power of a currency, caused by factors such as inflation, should equate to an equal fall in the exchange rate.
The Organisation for Economic Cooperation and Development (OECD) releases annual PPP data – some traders will use these figures to assess the value of each currency against the US dollar, making judgements about the overall trend for that following year.
It is important to note that using purchasing power parity is not necessarily the best strategy for short-term traders. The method does not account for short-term volatility, so it is only really useful for longer longer-term trading styles. This is why it is important for PPP to be just one part of an overall fundamental analysis strategy, and to be used alongside technical analysis indicators.
Trading forex in the short term will require traders to have a broader understanding of what can impact forex prices – such as politics, trade barriers and macroeconomic data releases.
Purchasing power parity and shares
Although PPP might not necessarily indicate which assets to focus on, as it does not indicate under-or over-valued assets as it does with forex pairs, it can explain the impact that exchange rates have on share prices and bonds.
For example, over the long term, if an investor wants to buy shares in a foreign company, any depreciation in its domestic currency will lower its purchasing power – meaning the same amount of money would buy fewer shares.
Share traders and investors can make decisions about the right time to buy or sell any shares, as well as when is best to hedge against currency risk.
Purchasing power parity indices
There are a range of different ways that economists have sought to measure purchasing power parity, ranging from professional indices – such as the OECD’s comparative price index – to light-hearted educational indices, such as the Big Mac index and KFC index.
OECD comparative price index
The OECD produces an annual report that measures the difference between its member countries using PPPs – comparing consumption levels to exchange rates.
The index looks at the number of US dollars in each country needed to buy a basket of goods that would cost $100 in the US.
For example, as of 2018, it would cost an Australian $123 to buy the basket of goods that cost an American $100. While it would cost someone in Poland just $51 for the same basket of goods.
The Big Mac index
Perhaps the most famous PPP index was devised by The Economist to measure how many units of a currency are needed to purchase a McDonald’s Big Mac – known as the Big Mac index. This is considered a fun-focused take on PPP but has nevertheless become extremely widely used. Once the value of a hamburger in each country is known, exchange rates can then be adjusted to show the purchasing power of each currency.
The burger was chosen due to the global reach of McDonald’s, with an estimated 36,889 outlets in 120 countries. Although it’s worth noting that due to differences in ingredients, even this isn’t a perfect measure of PPP.
Let’s say you wanted to compare the purchasing power of the US dollar and Danish krone using the Big Mac index. In January 2018, the index showed that the krone was undervalued against the dollar by 6.6% – the average Big Mac in the US was worth $5.28, while it was worth kr30 (the equivalent of $4.93). The PPP implied exchange rate would have worked out at 5.58, which is 6.6% lower than the actual exchange rate at the time of 6.08.
Following PPP theory, this would mean that over time, the Danish krone should increase by 6.6% to parity with the US dollar.
KFC index
The KFC index was created by Sagaci Research to assess the purchasing power parities of African currencies. The index is based on the Big Mac index, but in this case, the basket of goods being measured is KFC’s original 15-piece bucket.
This modification was made because McDonald’s restaurants are only found in three African countries – Morocco, Egypt and South Africa – whereas KFC is found in 20. This means that the purchasing power of various African currencies can be compared to the US dollar, euro and pound.
The KFC index isn’t necessarily an accurate measure for PPP, as it doesn’t take into account volatility levels, inflation and local costs.
PPP in everyday life
In everyday life, the concept of purchasing power parity might more commonly be known as the cost of living. The measure enables people to look at various aspects of consumerism and make comparisons between locations and over time.
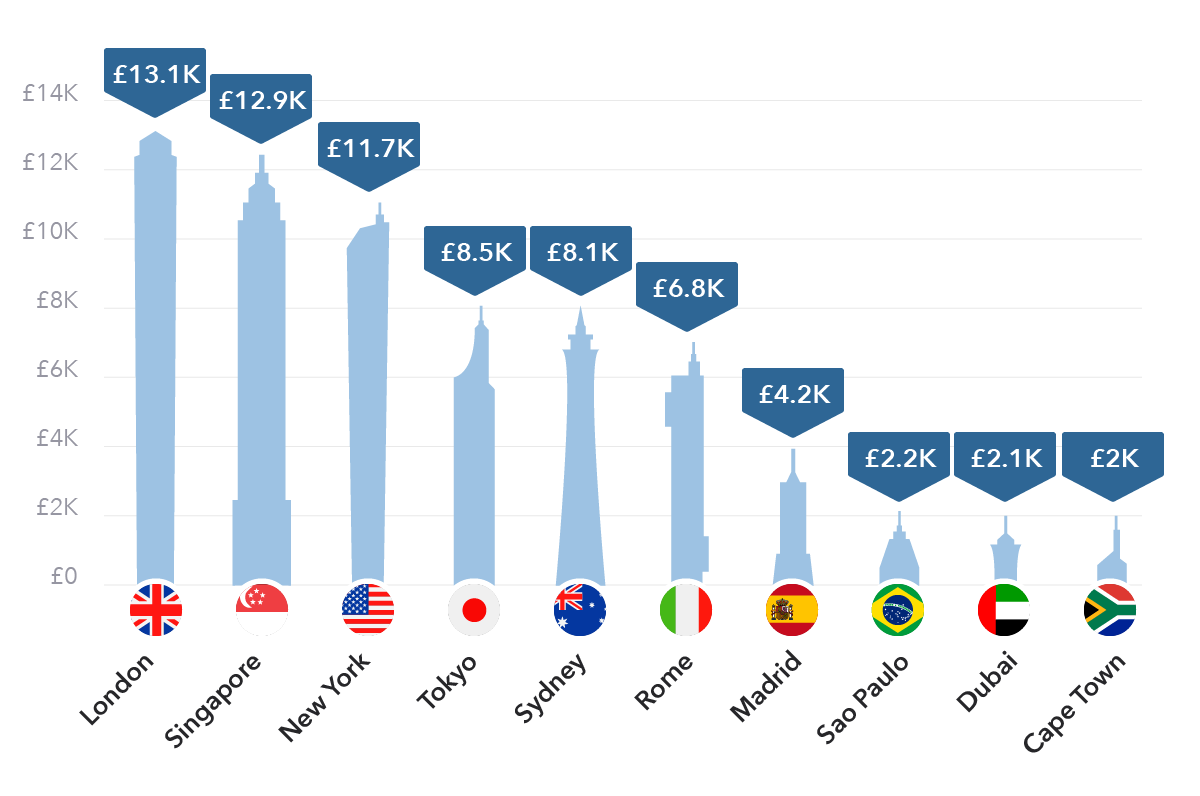
The below graph looks at the average cost of an apartment or flat in the centre of a major global city, per square metre. Using the data, we can estimate that – at the average flat size of 70 square metres – a flat in central London would cost £917,000, while a flat in central Cape Town would cost just
Cost of flats in major cities
As another example, we can look at coffee prices. A cup of coffee will have the same basic makeup regardless of where you buy it – coffee, water and milk – however the cost of each cup can vary hugely depending on where you buy it.
Traditionally, coffee in the United Arab Emirate (UAE) was all imported, which goes someway to explain why – on average – it has the most expensive cup of coffee. In the UAE, a cup of coffee would set you back £4.47, compared to just £0.78 in Italy.
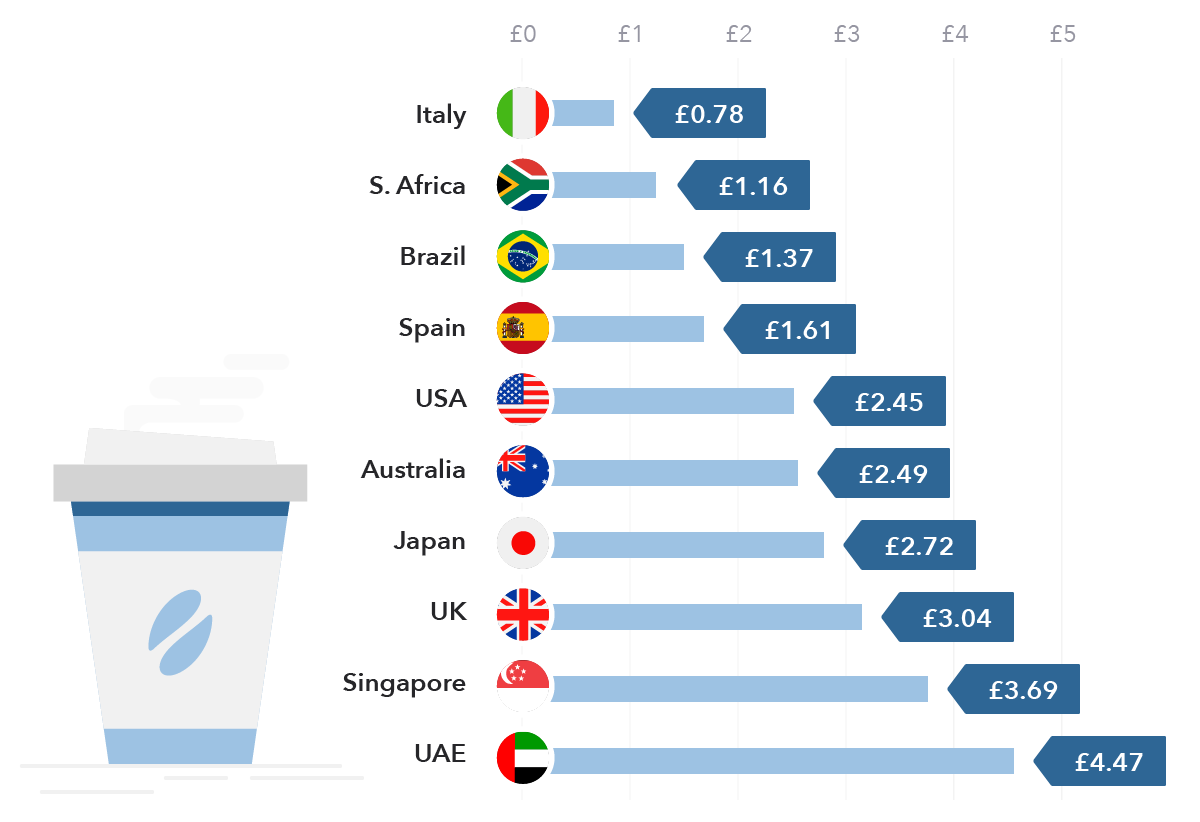
Especially with commodities like coffee, the purchasing power of a particular currency comes into play. Commodities are normally denominated in the US dollar, so any currency appreciation or depreciation will lead to a change in the amount of coffee you can buy.
Limitations of purchasing power parity
The theory of purchasing power parity relies on the idea of arbitrage – the opportunity to buy an item in one place, and sell it for higher price immediately in another, taking advantage of price differentials. This would eventually cause prices to converge, as the buying and selling would balance prices. However, in reality, there are transaction costs, government taxation and barriers to trade that prevent costs from equalising.
The theory is also reliant on the basket of goods being completely identical, or at best very similar goods. For a truly meaningful comparison, the basket would have to contain a wide variety of goods and services. The amount of data that has to be collected by a financial institution is huge, and it can be a complex process. For example, the International Comparisons Program (ICP) run by the United nations and the University of Pennsylvania looked 1000 products across each of the 147 countries that participated in the scheme.
Purchasing power parity summed up
⦁ Purchasing power parity (PPP) is an economic theory that suggests the prices of goods and services between two countries should be equal, once their currencies have been exchanged
⦁ PPP was introduced to be a more accurate and effective measure of a currency’s power
⦁ It is split into two types: absolute PPP, which doesn’t adjust for inflation, and relative PPP, which does
⦁ PPP is used to compare economic productivity and living standards between countries
⦁ Purchasing power parity is used to measure GDP and is used as an alternative to nominal GDP
⦁ The theory argues that tradable goods are more closely aligned with nominal exchange rates, while non-tradeable goods and services are closer to the PPP rate
⦁ PPP can also be used to assess socioeconomic situations, such as carbon emissions, global poverty, government manipulation and financial markets
⦁ Traders will often use PPP to assess a currency’s long-term forecast and exchange rate valuation – using it to identify over- and under-valued currencies
⦁ PPP can then be used to decide whether to take a long or a short position
⦁ PPP can also be used in share trading, to decide whether to hedge against currency risk
⦁ There are multiple indices that are used to measure PPP, including the OECD comparative price index, Big Mac index and KFC index
⦁ PPP is found in everyday life to explain the differences in living costs between two countries
⦁ There are significant limitations to the theory, such as its exclusion of other transactional costs, taxes and barriers to trade
Practice using purchasing power parity to inform your trading decisions by opening an IG demo account or continue learning about financial markets with IG Academy.
Source: IG


